
For any business intelligence solution to be effective, it needs to have demonstrable value for business users and to actually gain some traction within the organization. However, modern BI adoption can be a very complex task, especially when applied on top of numerous and complicated systems in the organization.

Overly complicated data structures, as can often be found in ERP platforms, can become a critical roadblock to the overall adoption of the BI solution, as they can make it difficult for end users to actually see results after the software has been implemented.
In this context, there are two types of systems that might be in place:
- Custom-built systems in which the data structure is well known across multiple levels in the organization (custom CRM or statistical applications could be an example)
- A purchased commercial CRM or ERP system (e.g. SAP or Microsoft Dynamics)
The first type of system poses less of a threat to BI adoption as its structure can be easily and quickly identified and matched to the data structure in your BI solution, enabling rapid development of ERP dashboards based on these structures. The second type, on the other hand, can become a real challenge in more complicated scenarios. Let’s examine an example of the second scenario, based on the Dynamics ERP platform.
Diving Deep into Microsoft Dynamics Data Structures and Tables
Challenges when deploying BI on top of your ERP system can be numerous and unexpected. Two of the most notable obstacles you might encounter with modern ERP systems are complicated data structures and business processes that do not reside in the data itself but are hidden within the ERP program’s code. These two factors can prove to be a real challenge and slow down initial deployment significantly. Microsoft Dynamics NAV alone, in the default setup, holds almost 1000 tables with over 50 000 different fields. This is a lot of data to browse through in order to get something meaningful.
Experience shows that when it comes to successful implementation of a BI solution, 20% of your success comes from your knowledge of the BI tool itself – and the easier the tool the quicker you can start leveraging its full potential and the learning curve is much less steep. The remaining 80% is the knowledge about your data structure and how to manipulate it to get the desired results. Hence, the more complicated and sophisticated the ERP you’re using, the more vital it is to be deeply familiar with its data structure in order to successfully implement a BI solution on top of it.
A Look into the Complexities of Structuring NAV and AX Data

An example of a data model when working with Dynamics data
Working with NAV’s data structure is quite problematic, as it is fairly complicated and also contains several hidden features within the data that might be hard to extract. In terms of data preparation, one will face problems with Option Fields (there is a similar mechanism in Dynamics AX called enums), that are stored as meaningless numbers, with their explanation hidden within NAV code. Taking care of most important ones, like Document Type allows you to work with NAV data with greater precision and accuracy.
Another difficulty with NAV is the structure of document and transaction tables. These are spread across over 15 different tables and even simple sales analysis might be not that simple from a NAV database perspective. In AX you have a quite powerful functionality called Financial Dimension. Although these are primarily used as General Ledger dimensions, they can be actually found in any transaction within AX. To get them to work with all transactions you need to perform quite complicated data transformation. There are many ‘hidden’ things within NAV and AX data structure that is hard to understand without a deep knowledge of the system itself.
Building Your First MS Dynamics Dashboards
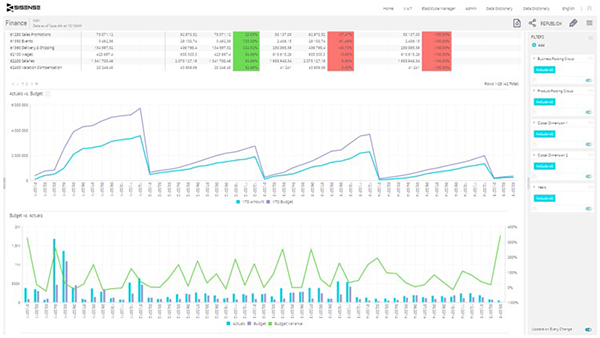
The next decision you need to make is which areas to represent first in your dashboards, and how to do it. Should I present sales as a timeline only, or as a general indicator as well? I need to analyze Sales, Purchases, Finances and stock, how to approach data so I could get those areas working as quick as possible? Those are the types of challenges you will encounter when starting with any ERP system from scratch. Some systems are easy to handle, and some less so – both NAV and AX are the latter. Once you get your data structure ready for a particular business need you are can go on to build a dashboard.
The way you structured your data will enable you to build dashboard reporting for specific business needs such as sales, purchasing, inventory, finance, receivables, etc. You can immediately start using these dashboards and adjust them to your specific needs, which is quicker and less error prone than when working directly with MS Dynamics.
The last thing one has to take into consideration is how the data structure can influence the way certain measures are calculated on dashboard level. A good example of this would be Amounts for General Ledger transactions in NAV which has Closing Entries at the end of each year, making analysis across multiple years a little more difficult.
Having these basic areas already covered at day one enables you to get a head start on your organization’s adoption of business analysis tool, and it is much easier to adjust an already existing structure to match your business specific needs than it is to start from scratch.
Author: Michael Becker is the owner of QBeeQ